UV/Vino
| Projects | |
|---|---|

| |
| Participants | V |
| Skills | |
| Status | Active |
| Niche | Electronics |
| Purpose | World domination |
Interface (older) UV/Vis detectors with a nanode instead of a chartrecorder, write interpretation software
Got a couple of different Uv/VIS detectors 2 are from the 80's and 1 is built more recently (>1995). One is a Varian that unfortunately exceeded its lamp burning hours and will most likely not bee operating until i get a new lamp.
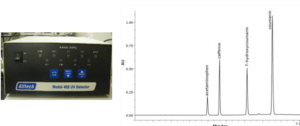
The 2 operational ones are an Alltech 450 fixed 254 nm UV spectrometer which is designed to function as a preperative HPLC detector but should work fine as a normal UV HPLC detector. The other one tho a bit older is actually nicer since it has a dial to adjust the wavelenght.
The 2 working detectors have integrator ports that read 1V at 1AU (90% of all photons absorbed)
The plan is to connect these detectors to the a/d converter of the nanode, write a program for the nanode that sets set the analogReference to INTERNAL, makes it read the analog port at a defined interval and printout the 10bit value including a timestamp. Write software that reads the data provided by the nanode to interpretate the signals over a defined timeline (HPLC run time) and provide provide a textual and graphical presentation of the data acquired.
So in the end Dreamer opted to take a look at PySide for writing my program, so i decided to take a look at PyQt. In short its a great library :) planning:
1. Solder nanode kit together - Done (after sitting quietly in a corner soldering half a sunday :P).
2. Measure the peak voltage at full absorbance on both spectrometers - Done
It seems that the detectors i am working with provide around 1V, but i did measure negative current. I am not planning to use the reference port for ranging my voltage but i'm not sure how well this nanode can handle an accidental low negative voltage.
3, Write a simple program for the nanode to do the writing. - Wrote a simple program for this and will have to improve/add features now that the GUI is somewhat working.
4. Write a simple GUI that will draw the absorbance peaks niceley over a timeframe using PyQt. - Done