Difference between revisions of "ALV January 2015/Finance overview"
(Created page with "File:ymp.png File:monthly.png") |
m (Qguv moved page ALV-20150125-finance-overview to ALV January 2015/Finance overview) |
||
| (4 intermediate revisions by one other user not shown) | |||
| Line 1: | Line 1: | ||
| − | [[File: | + | ==Yearly Membership Pool== |
| − | [[File: | + | |
| + | Techinc allows memberships to be paid in either monhtly or yearly installments (quarterly is also possible, but I digress). | ||
| + | |||
| + | A simplistic view of our bank-account would assume that the monthly incoming amount would be: | ||
| + | |||
| + | The amount of members X their monthly fee | ||
| + | |||
| + | However, this does not take into account the memberships that have already been paid forward for a period of up to a year (or even longer ?) | ||
| + | |||
| + | Thus, when reporting the monthly bank-account status, it has become relevant to note how much of what we got in from members is 'monthly memberships', how much of our account is 'the yearly memberships paid ahead of time' and how much then is the 'monhtly part' of that. | ||
| + | |||
| + | The image below demonstrates this mechanism. | ||
| + | |||
| + | Assume that blue bar at month 1 is the 'Year Membership Pool' as presented in the januari report (adjusted a bit since we gained one more year-membership since then). | ||
| + | |||
| + | The sum decreases with a 'monhtly part' each month, represented by the orange section. This is the total sum of 'monthly memberships' that the YMP represents. | ||
| + | |||
| + | The green-segments are new or re-newed yearly memberships. | ||
| + | |||
| + | [[File:Alv20150125-finance-Ymp.png]] | ||
| + | |||
| + | In this example, we see that over a 6 month time-span, the total level of YMP goes down somewhat. Seen over a year, the average level should stay level if no new people choose for a year-membership and the existing ones are just re-newed. | ||
| + | |||
| + | ==The monthly overview== | ||
| + | |||
| + | Over a month, we have a simplified situation which is represented in the graph below. | ||
| + | For each month, there are 5 bars provided. | ||
| + | |||
| + | *The first bar represents the amount of money that came in from memberships that month,. | ||
| + | *The second bar represents the monthly segment of the YMP (the orange bar in the other graph) | ||
| + | *The third bar is the summed total of the first and the second bars. | ||
| + | *The Fourth bar is our rent, set at 1605 euro | ||
| + | *The Fifth bar is the amount of money that we'd be short, that month, and needs to be paid from savings. | ||
| + | |||
| + | |||
| + | [[File:Alv20150125-finance-Monthly.png]] | ||
Latest revision as of 13:57, 12 September 2020
Yearly Membership Pool
Techinc allows memberships to be paid in either monhtly or yearly installments (quarterly is also possible, but I digress).
A simplistic view of our bank-account would assume that the monthly incoming amount would be:
The amount of members X their monthly fee
However, this does not take into account the memberships that have already been paid forward for a period of up to a year (or even longer ?)
Thus, when reporting the monthly bank-account status, it has become relevant to note how much of what we got in from members is 'monthly memberships', how much of our account is 'the yearly memberships paid ahead of time' and how much then is the 'monhtly part' of that.
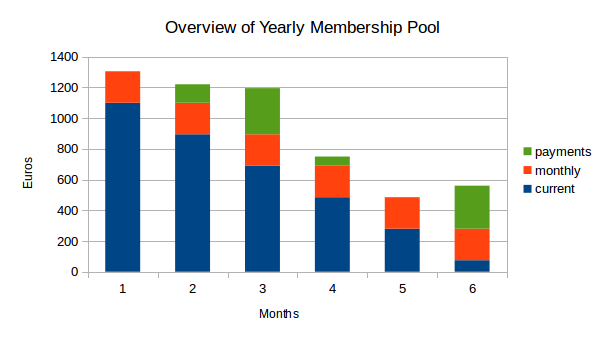
The image below demonstrates this mechanism.
Assume that blue bar at month 1 is the 'Year Membership Pool' as presented in the januari report (adjusted a bit since we gained one more year-membership since then).
The sum decreases with a 'monhtly part' each month, represented by the orange section. This is the total sum of 'monthly memberships' that the YMP represents.
The green-segments are new or re-newed yearly memberships.
In this example, we see that over a 6 month time-span, the total level of YMP goes down somewhat. Seen over a year, the average level should stay level if no new people choose for a year-membership and the existing ones are just re-newed.
The monthly overview
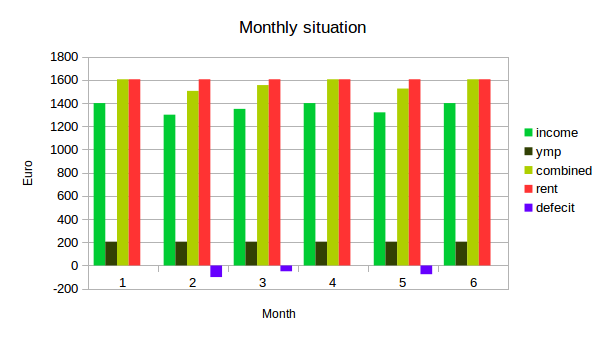
Over a month, we have a simplified situation which is represented in the graph below. For each month, there are 5 bars provided.
- The first bar represents the amount of money that came in from memberships that month,.
- The second bar represents the monthly segment of the YMP (the orange bar in the other graph)
- The third bar is the summed total of the first and the second bars.
- The Fourth bar is our rent, set at 1605 euro
- The Fifth bar is the amount of money that we'd be short, that month, and needs to be paid from savings.

