UV/Vino
| Projects | |
|---|---|

| |
| Participants | V |
| Skills | |
| Status | Active |
| Niche | Electronics |
| Purpose | World domination |
Interface (older) UV/Vis detectors with a nanode instead of a chartrecorder, write interpretation software
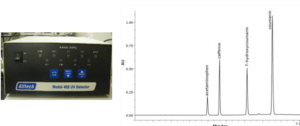
Got a couple of different Uv/VIS detectors 2 are from the 80's and 1 is built more recently (>1995). One is a Varian of which i really like the interface and performs many startup checks to ensure good operation, unfortunately the deuterium lamp has exceeded its burning hours and turned weak (the detector even reports this) and will most likely not bee operating until i get a new lamp. The second spectrometer is at the moment my favorite it has an adjustable turning wheel that enables you to choose the wavelenght of the detector, the wheel most likely directly corresponds to the grating. An overall awesome piece of engineering. The 3rd spectrometer (recently aquired) is an Alltech 450 UV spectrometer which is designed to function as a preperative HPLC detector but should work fine as a normal UV HPLC detector. All 3 have +- outputs for an integrator and a chart recorder. The plan is to connect these detectors to the a/d converter of the nanode, write a program for the nanode that makes it read the analog port at a defined interval, then print the 10bit value including a timestamp and write software that reads the data provided by the nanode to interpretate the signals over a defined timeline (HPLC run time) and provide provide a textual and graphical presentation of the data aquired.
For the lolz i started to play around with SDL libraries to draw the peaks but this does not feel very sane and im switching to PyGTK, a great oportunity to get to learn a bit more on this library (needless to say feel free to bash my code once it is complete because it _will_ bee ugly)
planning:
1. Solder nanode kit together - Done (after sitting quietly in a corner soldering half a sunday :P).
2. Measure the peak voltage at full absorbance on both spectrometers - Almost done
According to the manuals the Varian gives 12V at full absorbance, the oldskool spectrometer was adjusted with dip switches to give 1V at full absorbance, the Alltech model 450 unfortunately did not have much of a physical interface nor do i have good documentation on this detector. The only adjustable options are to set the sensitivity range and zero-ing the uv signal, holding down the autozero button produces 6.2 volt at the intergrator output port. If my plan to get an operator manual fails i shall open the detector, fully block the detector sensor and measure the output voltage. The suspicion is that it will provide 12V. For the Varian and the Alltech i will use a resistor based voltage regulator if anyone thinks this is a bad aproach or has suggestions it is much appreciated since i know as good as nothing about electronics. For the oldskool one i can according to [1] reference the Arduino ADC to 1,1V. At a resolution of 0.0011 this is, in terms of accuracy quite good contrasted to the telemetry provided by the oldskool spectrometer ;-)
3, Write a simple program for the nanode to do the writing. - Wrote a simple program for this and will improve/add features once the GUI is somewhat together
4. Write a simple GUI that will draw the absorbance peaks niceley over a timeframe using PyGTK. - Still Reading tutorials :)